MATLAB Lecture 01 - Solutions for lecture exercises
By Malte Ahm - ma@civil.aau.dk
This document contains the solutions to the exercises for the MATLAB lecture 01.
Contents
Load data from *.mat files to save time
loadMAT=1;
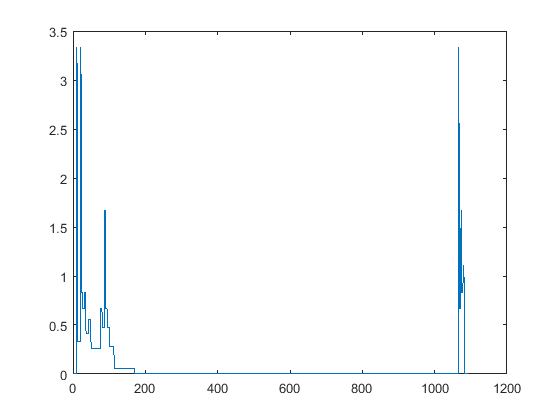
Exercise 1 - Load and plot rain gauge data
In this exercise I have loaded and plotted rain gauge data from the danish national rain gauge network SVK. KM2 file format (*.km2).
MATLAB code for solution:
% Rain gauge files
SVK22321_path = 'SVK22321_20120718_20120725.km2';
SVK22361_path = 'SVK22361_20120718_20120725.km2';
SVK22554_path = 'SVK22554_20120718_20120725.km2';
% Load rain data
if loadMAT == 1
    % Load rain gauge data from *.mat files
    load('RainGaugeData.mat')
else
    % Load rain gauge data from *.KM2 files
    SVK22321_data = LoadSVK_TS(SVK22321_path);
    SVK22361_data = LoadSVK_TS(SVK22361_path);
    SVK22554_data = LoadSVK_TS(SVK22554_path);
    save('RainGaugeData.mat','SVK22321_data','SVK22361_data','SVK22554_data');
end

% Plot data
plot(SVK22321_data(:,2))
Recalculate rain gauge data to mm/min
SVK22321_data(:,2) = SVK22321_data(:,2)/1000*60;
SVK22361_data(:,2) = SVK22361_data(:,2)/1000*60;
SVK22554_data(:,2) = SVK22554_data(:,2)/1000*60;
Plotning of rain gauge data
% Close previous figures
close all
% Open new figure
RainGaugeFigure = figure; hold on
% Plot rain gauge data
SVK22321_plot = stairs(SVK22321_data(:,1),SVK22321_data(:,2));
SVK22361_plot = stairs(SVK22361_data(:,1),SVK22361_data(:,2));
SVK22554_plot = stairs(SVK22554_data(:,1),SVK22554_data(:,2));
% Get axes handle
RainGaugeAxes = get(RainGaugeFigure,'CurrentAxes');
% Specify line color and style
set(SVK22321_plot,'color','b','LineStyle','-','LineWidth',2)
set(SVK22361_plot,'color','k','LineStyle','--','LineWidth',2)
set(SVK22554_plot,'color','r','LineStyle','-.','LineWidth',2)
% Limit axes
axis(RainGaugeAxes,[datenum(2012,07,18,18,00,00), datenum(2012,07,18,24,00,00), 0 0.2501])
% Set x axis to datetick
datetick('x','HH:MM','keeplimits')
% Set x-label
xlabel(RainGaugeAxes,'Time the 18th July 2012 [HH:MM]')
% Set y-label
ylabel(RainGaugeAxes,'Rain intensity [mm/min]')
% Define legend
legend(RainGaugeAxes,'SVK22321','SVK22361','SVK22554','Location','East')
legend(RainGaugeAxes,'boxoff')
% Define figure title
title('Plot of rain gauge data from the municipality of Aarhus the 18th July 2012')
% Show figure in publication without handle number
figure(RainGaugeFigure)
hold off

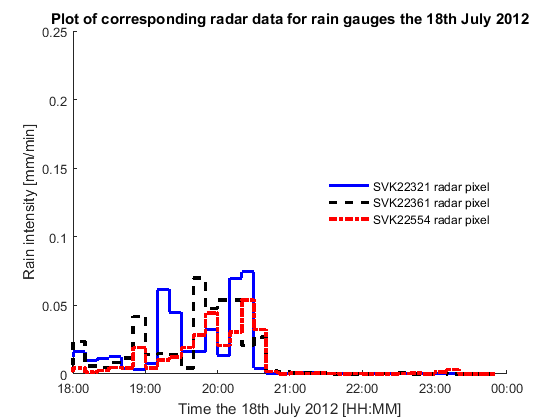
Exercise 2a - Load and plot weather radar data
In this exercise I have loaded and plotted weather radar data from radar pixel corresponding to the three rain gauges in the municipality of Aarhus by the use of radar data from the C-band weather radar located in Virring. Binary file format (*.wrk)
MATLAB code for solution:
% Weather radar data archive
WeatherRadarDataArchive = 'Virring';
WeatherRadarPrefix = 'ekxv';
StartTimeRadar = datenum(2012,07,18,00,00,00);
EndTimeRadar = datenum(2012,07,18,23,50,00);
% Load weather radar data
if loadMAT == 1
    % Load weather radar data from *.mat file
    load('WeatherRadarData.mat')
else
    % Load weather radar data from *.wrk files
    % Get number of radar data set.
    time=StartTimeRadar;
    numberofdataset=0;
    WeatherRadarTimeStamps=[];
    while time < EndTimeRadar+datenum(0000,00,00,00,00,01)
        numberofdataset=numberofdataset+1;
        WeatherRadarTimeStamps=[WeatherRadarTimeStamps; time];  %#ok
        time=time+datenum(0000,00,00,00,10,00);
    end
    % Create empty matrix for weather radar data
    WeatherRadarData=zeros(240,240,numberofdataset);
    % Load weather radar data
    for n=1:numberofdataset
        WeatherRadarData(:,:,n) = LoadRadarWRKFile(WeatherRadarTimeStamps(n,1),WeatherRadarDataArchive,WeatherRadarPrefix);
    end
    % Save weather radar data to *.mat file
    save('WeatherRadarData.mat','WeatherRadarData','WeatherRadarTimeStamps','numberofdataset');
end
% Empty rain gauge radar pixel matrix
SVK22321_RadarData = zeros(numberofdataset,2,1);
SVK22361_RadarData = zeros(numberofdataset,2,1);
SVK22554_RadarData = zeros(numberofdataset,2,1);
% Get radar timestamps for radar pixel plot
SVK22321_RadarData(:,1,1) = WeatherRadarTimeStamps;
SVK22361_RadarData(:,1,1) = WeatherRadarTimeStamps;
SVK22554_RadarData(:,1,1) = WeatherRadarTimeStamps;
% Get radar data corresponding to rain gauge position
SVK22321_RadarData(:,2,1) = WeatherRadarData(110,127,:);
SVK22361_RadarData(:,2,1) = WeatherRadarData(115,124,:);
SVK22554_RadarData(:,2,1) = WeatherRadarData(117,124,:);
Plotning of weather radar pixel data for rain gauge locations
% Open new figure
RadarFigure = figure; hold on
% Plot weather radar data
SVK22321_RadarData_plot = stairs(SVK22321_RadarData(:,1),SVK22321_RadarData(:,2));
SVK22361_RadarData_plot = stairs(SVK22361_RadarData(:,1),SVK22361_RadarData(:,2));
SVK22554_RadarData_plot = stairs(SVK22554_RadarData(:,1),SVK22554_RadarData(:,2));
% Get axes handle
RadarAxes = get(RadarFigure,'CurrentAxes');
% Specify line color and style
set(SVK22321_RadarData_plot,'color','b','LineStyle','-','LineWidth',2)
set(SVK22361_RadarData_plot,'color','k','LineStyle','--','LineWidth',2)
set(SVK22554_RadarData_plot,'color','r','LineStyle','-.','LineWidth',2)
% Limit axes
axis(RadarAxes,[datenum(2012,07,18,18,00,00), datenum(2012,07,18,24,00,00), 0 0.2501])
% Set x axis to datetick
datetick('x','HH:MM','keeplimits')
% Set x-label
xlabel(RadarAxes,'Time the 18th July 2012 [HH:MM]')
% Set y-label
ylabel(RadarAxes,'Rain intensity [mm/min]')
% Define legend
legend(RadarAxes,'SVK22321 radar pixel','SVK22361 radar pixel','SVK22554 radar pixel','Location','East')
legend(RadarAxes,'boxoff')
% Define figure title
title('Plot of corresponding radar data for rain gauges the 18th July 2012')
% Show figure in publication without handle number
figure(RadarFigure)
hold off
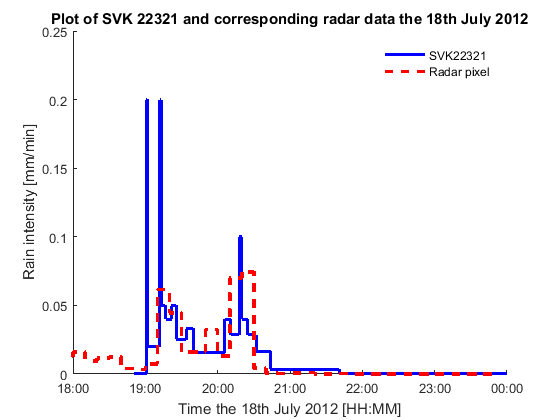
Exercise 2b - Plot rain gauge and weather radar data
In this exercise I have plotted rain gauge data for SVK22321 along with corresponding weather radar from the C-band weather radar located in Virring.
Plotning of corresponding weather radar to rain gauge data
% Open new figure
RainGaugeRadarFigure = figure; hold on
% Plot rain gauge and weather radar data
SVK22321_RainGaugeRadar_Gauge_plot = stairs(SVK22321_data(:,1),SVK22321_data(:,2));
SVK22321_RainGaugeRadar_Radar_plot = stairs(SVK22321_RadarData(:,1),SVK22321_RadarData(:,2));
% Get axes handle
RainGaugeRadarAxes = get(RainGaugeRadarFigure,'CurrentAxes');
% Specify line color and style
set(SVK22321_RainGaugeRadar_Gauge_plot,'color','b','LineStyle','-','LineWidth',2)
set(SVK22321_RainGaugeRadar_Radar_plot,'color','r','LineStyle','--','LineWidth',2)
% Limit axes
axis(RainGaugeRadarAxes,[datenum(2012,07,18,18,00,00), datenum(2012,07,18,24,00,00), 0 0.2501])
% Set x axis to datetick
datetick('x','HH:MM','keeplimits')
% Set x-label
xlabel(RainGaugeRadarAxes,'Time the 18th July 2012 [HH:MM]')
% Set y-label
ylabel(RainGaugeRadarAxes,'Rain intensity [mm/min]')
% Define legend
legend(RainGaugeRadarAxes,'SVK22321','Radar pixel')
legend(RainGaugeRadarAxes,'boxoff')
% Define figure title
title('Plot of SVK 22321 and corresponding radar data the 18th July 2012')
% Show figure in publication without handle number
figure(RainGaugeRadarFigure)
hold off
Exercise 3 - Load flow data and plot these along with rain gauge and weather radar data
In this exercise I have loaded and plotted rain gauge data from the danish national rain gauge network SVK.
% Flow data path (*.xlsx file)
FlowData_path='VibyFlowData_20120718_20120719.xlsx';
% Load flow data
if loadMAT == 1
    % Load flow data from *.mat file
    load('FlowData.mat')
else
    % Read flow time stamps from *.xlsx file
    [~,txt,~] = xlsread(FlowData_path,'A:A');
    FlowTimeStampStrings=txt;
    % Transforme time stamp strings to datenum time stamps (proces is slow)
    FlowTimeStamps=zeros(size(FlowTimeStampStrings,1),1);
    for n=1:size(FlowTimeStampStrings,1)
        try
            FlowTimeStamps(n)=datenum(FlowTimeStampStrings(n), 'dd-mm-yyyy HH:MM:SS');
        catch err
            FlowTimeStamps(n)=datenum(FlowTimeStampStrings(n), 'dd-mm-yyyy');
        end
    end
    % Read inlet flow data from *.xlsx file
    [num,~,~] = xlsread(FlowData_path,'B:B');
    FlowInlet=num;
    % Read outlet flow data from *.xlsx file
    [num,~,~] = xlsread(FlowData_path,'C:C');
    FlowOutlet=num;
    % Save weather radar data to *.mat file
    save('FlowData.mat','FlowTimeStamps','FlowInlet','FlowOutlet');
    % Clear unused varibles
    clear('num','txt','err','FlowTimeStampStrings')
end
Plotning of rain gauge data (SVK22361), corresponding weather radar pixel and inlet flow to Viby WWTP
% Open new figure
WWTPFigure = figure; hold on
% Plot rain gauge, weather radar, and flow data
[WWTPAxes,H1,H3] = plotyy(SVK22361_data(:,1),SVK22361_data(:,2),FlowTimeStamps,FlowInlet,'stairs');
H2 = stairs(SVK22361_RadarData(:,1),SVK22361_RadarData(:,2));
% Set axes borders
box off
% Specify line color and style
set(H1,'color','b','LineStyle','-','LineWidth',2)
set(H2,'color','k','LineStyle','--','LineWidth',2)
set(H3,'color','r','LineWidth',2)
set(WWTPAxes(2),'YColor','r')
% Reverse first y-axis
set(WWTPAxes(1),'YDir','reverse')
% Limit axes (The x axis limits has to be equal for the two axes)
axis(WWTPAxes(1),[datenum(2012,07,18,18,00,00), datenum(2012,07,19,00,00,00), 0 0.2501])
axis(WWTPAxes(2),[datenum(2012,07,18,18,00,00), datenum(2012,07,19,00,00,00), 0 1400])
% Set x axis to datetick (Only set for one of the two axes - removed from the other)
datetick(WWTPAxes(1), 'x', 'HH:MM', 'keepticks', 'keeplimits')
set(WWTPAxes(2),'XTick',[])
% Set x-label (Only set for one of the two axes)
xlabel(WWTPAxes(1),'Time the 18th July 2012 [HH:MM]')
% Set y-label
ylabel(WWTPAxes(1),'Rain intensity [mm/min]')
ylabel(WWTPAxes(2),'Flow rate [l/s]')
% Define legend
legend(WWTPAxes(1),'SVK22321','Radar pixel','Inlet flow')
legend(WWTPAxes(1),'boxoff')
% Define figure title
title('Rain gauge SVK 22321, corresponding radar pixel, and Viby WWTP inlet flow')
% Show figure in publication without handle number
figure(WWTPFigure)
hold off
